கற்பித்தல் ஆய்வு
RSI 70 கடந்த ஒவ்வொரு நாளையும் தனி reversal signal என எண்ணக்கூடாது
2024 Q1 BTCUSDT daily closes மற்றும் warm-up data-வில் Wilder RSI(14)-ஐ மீள்கணக்கிட்டு, தொடர்ச்சியான high-state நாட்களை episodes ஆக இணைத்து persistence, cooling rule, incomplete forward window ஆகியவற்றை ஆய்வு செய்கிறது.
கல்வி தகவல் மட்டும்; financial advice அல்லது trading signal அல்ல.
வாசகர்கள் அடிக்கடி கேட்பவை
- Warm-up மற்றும் seed என்ன?
- 70 கடந்த தொடர்ச்சி ஒரு event தானா பலவா?
- Cooling period எப்போது முடியும்?
- Forward window overlap எப்படி?
- High state விற்பனை உத்தரவாகுமா?
இந்தப் பக்கத்தில் கற்பவை
- Wilder RSI chain சரிபார்த்தல்.
- Consecutive high days-ஐ episode ஆக்குதல்.
- Threshold மற்றும் window sensitivity வெளிப்படுத்துதல்.
- Price observation மற்றும் strategy return பிரித்தல்.
முக்கியப் பகுதிகள்
RSI high state என்பது வகை
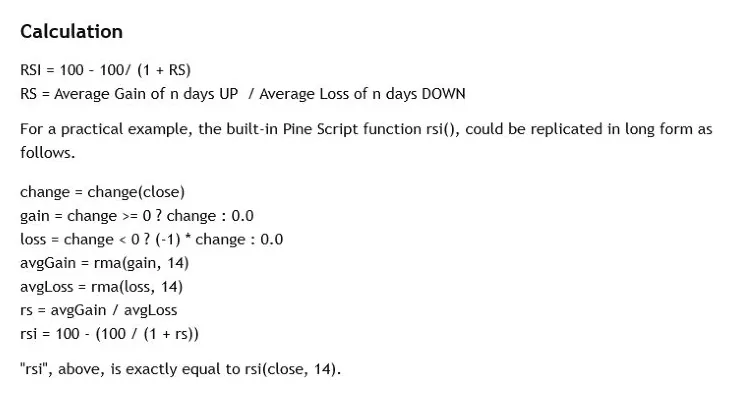
RSI சமீப average gains மற்றும் losses-ன் smoothed ratio. 70 threshold ஒரு பொதுவான classification parameter; price உடனே கீழே போகும் இயற்கை சுவர் அல்ல.
Strong rise நீண்டால் average gain அதிகமாக இருந்து RSI பல completed days உயர்ந்த நிலையில் நீடிக்கலாம். அந்த persistence இந்த ஆய்வின் முக்கிய evidence.
Wilder seed மீளுருவாக்கம்
முதல் average gain மற்றும் loss, ஆரம்ப 14 changes-ன் arithmetic mean; பின்னர் Wilder recursion. நடுவில் rounding செய்யாமல் source order பாதுகாக்க வேண்டும்.
Research quarter மட்டும் download செய்தால் early values வேறு. Warm-up start, UTC boundary, row count மற்றும் hash manifest-ல் சேர்க்கப்பட வேண்டும்.
Episode தான் unit
RSI 72, 75, 73 என மூன்று நாட்கள் இருந்தால் மூன்று independent signals அல்ல; ஒரே continuous high-state episode. Exit செய்து cooling நாட்கள் முடிந்த பிறகே புதிய episode.
Day count, episode count இரண்டும் output-ல் இருக்கும்; ஒன்றை மற்றொன்றாகக் காட்டுவது sample inflation.
விரிவான விளக்கம்
Completed day மட்டும்
Intraday close மாறும்போது RSI 70-க்கு மேல் சென்று மீண்டும் கீழே வரலாம். Historical daily candle அந்த பாதையை வைத்திருக்காது; final UTC close மட்டும் இருக்கும்.
ஆய்வு நாள் முடிந்த பிறகே state label தருகிறது. Mobile screen-ல் live value காட்டப்பட்டாலும் அது இந்த historical event definition-க்கு சமம் அல்ல.
Cooling rule முன் தீர்மானம்
Threshold அருகே 69.8, 70.2 என மாறினால் பல சிறு episodes தோன்றலாம். இரண்டு அல்லது மூன்று completed below-threshold days வேண்டுமா என்பதை results பார்க்கும் முன் எழுத வேண்டும்.
Different cooling settings sensitivity table-ல் ஒன்றாகக் காட்டப்பட வேண்டும்; event count அதிகமான rule மட்டும் தேர்ந்தெடுக்கக்கூடாது.
High-state persistence ஒரு எதிர் உதாரணம்
Price தொடர்ந்து உயரும்போது RSI 70-க்கு மேல் பல நாட்கள் இருக்க முடியும். உடனடி reversal மட்டும் கொண்ட screenshots தேர்ந்தெடுத்தால் இந்த முக்கிய failure case மறையும்.
Longest episode, all high-state days மற்றும் later-high records முழுமையாகத் தங்க வேண்டும்; narrative-க்கு பொருந்தாத rows delete செய்யப்படாது.
Forward window நிரந்தரம் அல்ல
எவ்வளவு காலம் காத்திருந்தாலும் ஒருநாள் decline வரும் வாய்ப்பு அதிகரிக்கும். அதனால் 1, 3, 5 completed days போன்ற finite windows முன்கூட்டியே freeze செய்ய வேண்டும்.
Window முடிவதற்கு முன் sample முடிந்த episode censored எனக் குறிக்கப்படும்; அதை success அல்லது failure ஆக கட்டாயமாக மாற்றக்கூடாது.
Overlapping windows independent அல்ல
இரண்டு episodes அருகில் இருந்தால் அவற்றின் five-day observations ஒரே price days-ஐ பகிரலாம். அவற்றை தனித்தனி evidence எனக் கணக்கிடுவது uncertainty-ஐ குறைத்து காட்டும்.
Output overlap-group ID வைத்திருக்கும். Episode count மற்றும் independent observation-group count இரண்டும் வெளிப்படையாக இருக்கும்.
Threshold sensitivity
65, 70, 75 வேறு state durations மற்றும் episode counts தரும். பல thresholds சோதித்து desired price outcome தரும் ஒன்றை மட்டும் வெளியிடுவது parameter mining.
முதன்மை 70 rule முன் fixed. Alternatives கல்வி sensitivity ஆக மட்டும், எல்லா rows மற்றும் same window rules உடன் காட்டப்பட வேண்டும்.
Price change strategy return அல்ல
High episode பிறகு close மாற்றத்தைப் பதிவு செய்தாலும் executable entry, exit, borrow, fee, Slippage, Stop Loss அல்லது Position Size இல்லை. Short position-க்கு Liquidation risk கூட விடுபட்டது.
அதனால் win rate, average return அல்லது sell recommendation இல்லை. Price observation-ஐ indicator behavior என மட்டுமே வாசிக்க வேண்டும்.
Boundary sequences
Warm-up முழுவதும் gains மட்டும் இருந்தால் average loss zero; fixed rule RSI 100. Losses மட்டும் என்றால் 0 அருகில்; flat series-ல் zero-over-zero கையாளும் rule தெளிவாக வேண்டும்.
கணக்கிட முடியாத மதிப்பு அல்லது முடிவில்லா மதிப்பு வந்தால் stale result காட்டாமல் error state காட்ட வேண்டும். இந்த synthetic boundaries formula test; future market claim அல்ல.
Local audit table
Date, close, change, gain, loss, average gain, average loss, RS, RSI, episode ID, cooling count மற்றும் overlap group ஒவ்வொரு row-லும் சேமிக்கப்பட வேண்டும்.
கணக்கு browser-ல் மட்டுமே நடக்கும்; account data அல்லது API key தேவையில்லை. Public dataset screenshot-ல் source மற்றும் date தெளிவாக இருக்க வேண்டும்.
Threshold event ஒன்றுக்கு ஒரே வரையறை
RSI 69.9-லிருந்து 70.1 சென்றது first cross. 78-லிருந்து 72 வந்தாலும் இன்னும் 70 மேல்; அதை புதிய entry event என்று எண்ணக்கூடாது. Exit செய்து மீண்டும் cross செய்தால் மட்டுமா, அல்லது ஒவ்வொரு candle-யும் event-ஆ என்பதைக் data பார்க்கும் முன் எழுத வேண்டும்.
Eventக்கு பின் 1, 3, 5 completed candles close change-ஐ ஒரே முறையில் பதிவு செய்யலாம். Best high மட்டும் தேர்ந்தெடுத்தால் hindsight bias. Continued overbought, reversal, sideways அனைத்தும் table-ல் இருக்க வேண்டும்.
Strong trend-ல் RSI நீண்ட நேரம் 70 மேல் இருக்கலாம். Threshold recent average gain/loss relation மட்டும்; resistance, order book, future direction இல்லை. Lab signal, win rate, short recommendation வழங்காது.
கற்பித்தல் வரம்பு
Fixed historical daily closes-ல் state persistence audit மட்டும்; entry, short, Stop Loss, Position Size, fees, return அல்லது recommendation இல்லை.
பயன்படுத்திய தரவுத்தொகுப்பு
rsi-overbought-btcusdt-1d-2024-q1
படிகள்
- Q1 research window-க்கு முன் குறைந்தது 14 changes warm-up பெறவும்.
- Wilder seed மற்றும் recursion-ஐ full precision-ல் கணக்கிடவும்.
- Completed UTC close-ல் RSI >=70 states கண்டறியவும்.
- தொடர்ச்சியான states-ஐ episode ஆக இணைத்து fixed cooling rule பயன்படுத்தவும்.
- 1,3,5-day windows-ன் incomplete மற்றும் overlap status-ஐ தனியாகக் குறிக்கவும்.
முடிவை எப்படிப் படிப்பது
70 என்பது fixed parameters-ல் historical relative-strength state; அது நீடிக்கலாம், வெளியேறினாலும் future direction உறுதி இல்லை.
₹ கணக்கீட்டு உதாரணம்
- சூழல்
- Average gain ₹2, average loss ₹1.
- கணக்கீடு
- RS=2; RSI=100-100/(1+2)=66.67.
- பொருள்
- 66.67 historical smoothed ratio; target price அல்லது action அல்ல.
அடிக்கடி நேரும் தவறு
RSI 70-க்கு மேல் இருந்த பத்து தொடர்ச்சியான நாட்களை பத்து independent விற்பனை உத்தரவுகளாக எண்ணி, பின்னர் fall ஆனவற்றை மட்டும் வைத்துக்கொள்வது.
சரிபார்ப்புப் பட்டியல்
- Dataset, warm-up, UTC, hash verify.
- Wilder seed/recursion fixed.
- Continuous days episode ஆக.
- Cooling மற்றும் windows முன் freeze.
- Persistence, censored, overlap வைத்திருக்கவும்.
- Completed closes மட்டும்.
- Return அல்லது sell advice வேண்டாம்.
இந்தப் பக்கத்தின் வரம்புகள்
- Short Q1 sample future state அல்ல.
- Threshold, cooling, window researcher choices.
- Daily data intraday crossing காட்டாது.
- Execution rules இல்லாததால் backtest அல்ல.
ரிஸ்க் குறிப்பு
RSI 70 ஒரு historical state label மட்டும்; உடனடி fall, sell action, future reversal அல்லது strategy performance-ஐ இந்த ஆய்வு கூறாது.
ஆதாரங்கள்
- www.tradingview.comசரிபார்த்தது 2026-08-02
- www.tradingview.comசரிபார்த்தது 2026-08-02
- developers.binance.comசரிபார்த்தது 2026-08-02
- data-api.binance.visionசரிபார்த்தது 2026-08-02
- www.fidelity.comசரிபார்த்தது 2026-08-02
- chartschool.stockcharts.comசரிபார்த்தது 2026-08-02